Where the Lab's prices come from
The stress tests, replays and projections are computed from twenty years of real daily prices, a fixed price history that ships with each release; the corner label says which prices and where they end, and a copy of Bellwether without them says so instead of guessing.
- Who it is for
- Everyone on the book
- Reading time
- 3 min read
- Updated
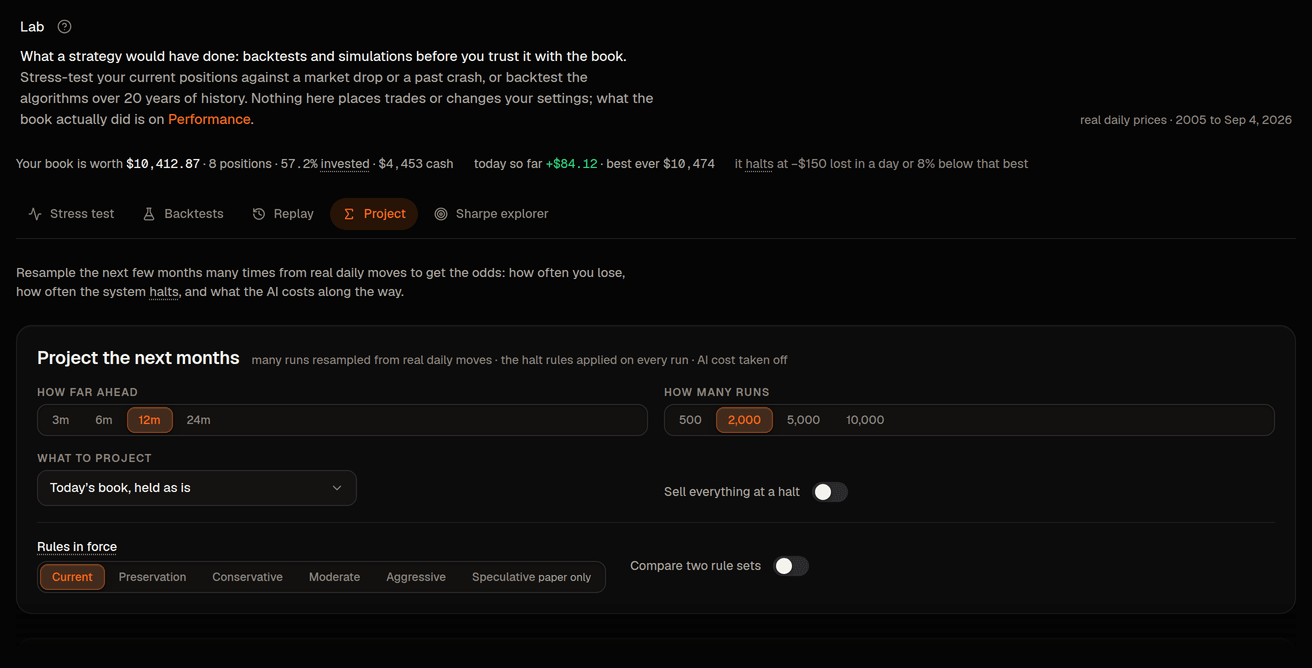
Every number on Lab is computed from a price history, and the label in the top-right corner of the says which one and where it ends. On the live console it reads real daily prices, followed by the first year and the last day the history covers (for example "2005 to Sep 4, 2026"): daily bars for the twenty stocks the desk follows plus the benchmark and sector ETFs (SPY, QQQ, the bond and sector funds), from the first session of 2005 to the most recent refresh. It is a fixed price history that ships with each release, so the screen you are reading, the queued backtests and the desk itself all compute on identical prices.
What the history is used for
| Tab | What it takes from the history |
|---|---|
| Stress test | each position's sensitivity to the market (measured over the last year of daily moves) and its typical daily range |
| Replay | the real path of every position through the episode (2008, 2020, 2022, late 2018, the 2023 bank run, and the worst stretch in the history), not an estimate from the index |
| Project | the pool of real daily moves that the projection resamples into thousands of possible next months |
| Backtests | the full twenty years, dividends and splits included, for every run and sweep |
Prices are adjusted for splits and dividends, so a long backtest measures total return. The history ends at the last refresh, which happens with releases rather than every night, and the corner label always shows that end date: a replay of "today's book" uses today's positions against prices that stop there. The line under each result repeats the kind of prices, the first and last day, and how many names it covers.
What the label can say
- real daily prices, with the first year and the last day: the history described above. This is the only thing the live console computes on.
- prices not loaded: this copy of Bellwether could not find its price history. Instead of running on made-up numbers, Stress test, Replay and Project are marked unavailable and show one amber note, Bellwether's operator is alerted automatically, and the Lab opens on Backtests, which still works along with the Sharpe explorer. Nothing about trading is affected; the Lab never places or changes anything.
- synthetic sample: a small made-up series used on development machines to exercise the screens. It never appears on the live console; if you are looking at a developer's copy, the line under every result repeats that the numbers say nothing about markets.
NoteThe Lab's history is separate from the live prices the desk trades on. Quotes for decisions come from the market-data feed you see on Markets; the Lab reads a fixed price history so that the same question gives the same answer tomorrow.
Why a fixed history and not the live feed
A what-if is only useful if it is repeatable: the same book, the same episode and the same rules should give the same answer on any day and on any machine, and two people comparing a result should be looking at the same prices. A price history that ships with the release does that; a feed that fills in as the day goes would not. The trade-off is freshness, which the end date in the corner makes visible. Moving the Lab onto the platform's own price tables, refreshed nightly and still versioned, is planned; until then the date in the corner is the truth about what the Lab knows.