How to read \"vs SPY\": the book against the index, after AI cost
What the row under the Overview figures and the Against SPY section on Performance compare, why the gap is in points, what "after AI cost" and "before tax" mean, why a young gap prints in plain type, which close it is dated by, and what the Discovery tile counts.
- Who it is for
- Everyone on the book
- Reading time
- 7 min read
- Updated
The fair question to ask of a platform that pays for a model every day is the plain one: would I have done better just holding SPY? Bellwether answers it on the front page. Right under the figures on the Overview, one row compares this book with SPY, the S&P 500 fund, over the same days and after the model's running cost; the Against SPY, after AI cost section on Performance shows the two returns side by side. This article says exactly what is compared, why the answer is worded the way it is, and what it does not claim.
- Where
- The row under the figures on the Overview, and Performance › Against SPY, after AI cost
- What it compares
- This book's return with the model's cost taken out, against SPY's return, over the trading days both have closed
- When it updates
- Once a session: it is dated by the last close both sides have ("through Sep 4"), never by the clock
- What it changes
- Nothing. No trade, limit or weight reads it
- Model cost
- None. It is arithmetic over records the platform already keeps
What the row says
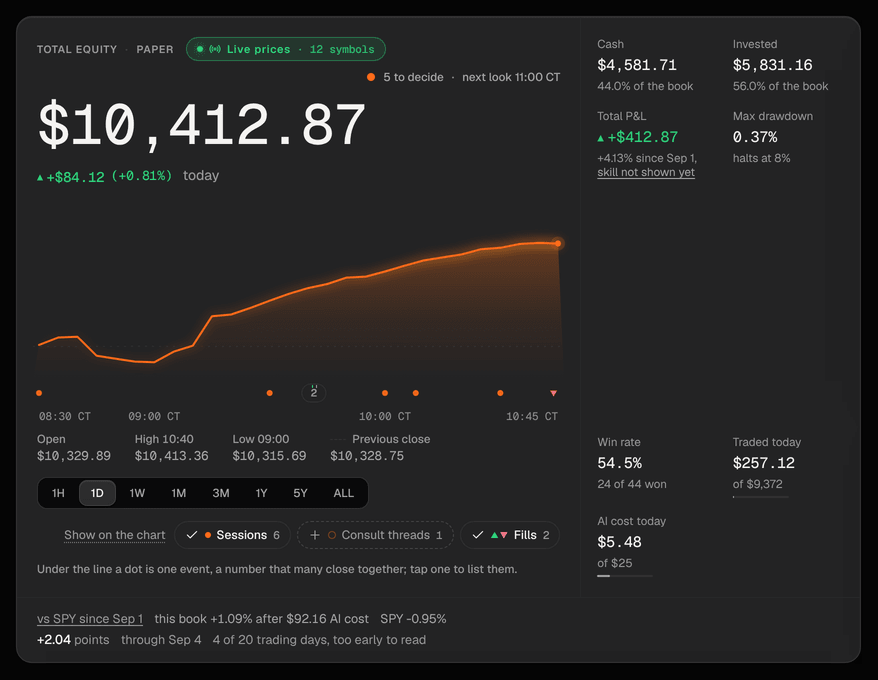
Read it left to right; the row states everything it needs, so it can be read on its own wherever it wraps. vs SPY since Sep 1 names the first trading day that counts, the same start Made overall names above it. The comparison itself runs from the close before that day, the book's first funded close, which is why the Performance section words it "since the Aug 31 close (Sep 1 the first day counted)": the Aug 31 close is the starting line, Sep 1 is the first day whose move counts. this book +1.09% after $92.16 AI cost is the book's own return over those days with the model's running cost already taken out, and the cost itself in dollars, so the figure above it (before the cost) and this row can be read together instead of looking like two different books. A live book whose tax lots are not tracked yet adds before tax, so nobody mistakes a pre-tax figure for what they keep. SPY -0.95% is the index fund over exactly the same days. Then the gap: the difference between those two returns, so it is in points (percentage points; switch on plain words in Settings and it says so in full), not a percent of anything: +1.09% against -0.95% reads +2.04 points, and on an older book 10.06% down against 0.31% down reads 9.75 points behind. through Sep 4 dates it: the last trading day both the book and SPY have a close for. The label opens the Performance section that lays the same three numbers out as a table.
Why a young gap is in plain type
For its first 20 trading days the gap prints signed and in plain type ("+2.04 points") with the count beside it ("4 of 20 trading days, too early to read"), takes no color and no word like ahead or behind. A difference of two returns over a handful of days is arithmetic, not a reading: it can flip sign twice in a week on nothing but which days the book happened to be more invested than the index. From 20 trading days on it reads "0.42 points ahead" or "9.75 points behind" in green or crimson with an arrow, and the count moves into the date ("130 trading days through Sep 4"). That is still a description of what happened, not a claim of skill. Whether any of it is skill rather than the market, the sectors the book leaned into, or luck is a separate question with its own floors, answered beside the chart on Performance in Luck or skill?.
The section on Performance
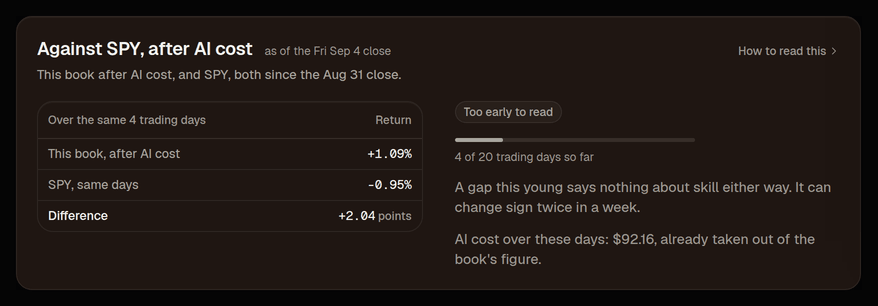
The section sits on the Results tab right under the Equity vs benchmarks chart whose two lines it compares. It holds three rows over the same trading days: this book, after AI cost; SPY, same days; and the difference, the gap the Overview row prints. Under 20 days a short meter shows how far along it is and the difference stays plain; from 20 days on a small line sketches the difference along the compared days. Choose a range at the top of the page (1W, 1M) and the section compares over that range instead; a range shorter than 20 trading days says it is too short to read, with no meter, because a week can never get there. One sentence in the section states the AI cost over those days in dollars, so "after AI cost" is a number you can check, and a live book without tax lots says its figures are before tax. The header's third figure, vs SPY, is the same comparison before the model's cost; switch net of AI cost on at the top of the page and it becomes the after-cost figure the section leads with.
Which days count, and why it never says today
Only days both sides have closed. During a session the book has an intraday value but SPY's close for the day does not exist yet, so the comparison stops at the previous close and says so; a few hours after the bell, when the day's index prices are in, it moves forward one day. If the platform bridged the newest close from that session's last prices rather than the official close, the row says "through Sep 4, at that day’s last prices" and Performance says "at Sep 4’s last prices" instead of "as of the Fri Sep 4 close". At the weekend and before the open it reads exactly as it did after Friday's close, dated Friday. The model's cost is counted the same way the days are: what the desk spent over a weekend or a holiday is charged to the next trading day, so a Saturday research run shows up in Monday's figure rather than vanishing between two closes. It never says live, today or now, because it is none of those.
The Discovery tile
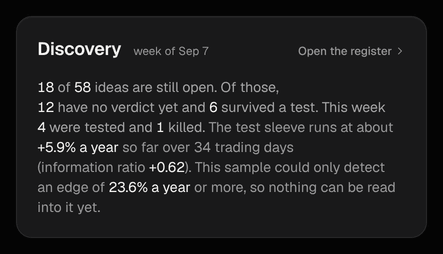
The comparison with SPY says what the book did. The small Discovery panel in the Overview's right-hand column, right after the alerts, says in a few short sentences what the platform is doing to find something better than the index. 15 of 44 ideas are still open counts the ideas on the research register with no final verdict against them, and the next sentence splits them honestly: no verdict yet (written down and never measured, or run without reaching a verdict, for example still below the number of results its own rule needs) and survived a test (measured and not killed), so "open" never reads as "promising". This week 3 were tested and 2 killed counts Monday to Sunday; on a quiet Monday it reads zero and says how many days ago the last verdict landed, because a week in which nothing was tested is the thing this tile exists to show. When an idea survives its review and trades in a small test sleeve, the tile adds two sentences: the sleeve's edge so far in percent a year, its information ratio (that edge divided by how much it swings, the usual way to size an edge against its noise; +0.5 sustained over years would be very good), and the smallest edge a sample that short could even detect, in the same unit, so "+5.9% a year over 34 days" is never read as a result when the sample could only have detected 24%. Under 20 days the sleeve sentence gives the count and no number at all. Until a sleeve exists it says so. The tile's one link, Open the register, opens the register on the Evidence tab of Performance, where every idea ever tested stays listed by name, the dead ones included; the Overview never prints the names.
What it does not say
- It does not say the desk is skilled or unskilled. Ahead or behind over these days is a fact; skill is Luck or skill?'s question, and the Evidence tab keeps the longer record.
- It does not adjust for risk. A book that holds cash is expected to trail a rising index and lead a falling one; the Luck or skill? split shows how much of the result is simply how invested the book was.
- It is not a forecast. Nothing on either projects the difference forward.
- It is before tax on a live book until tax lots are tracked, and it says so. On a there is no tax to take out.
NoteThe comparison needs SPY's prices for the book's days. If they are not on the platform for a stretch, the line says nothing is compared rather than printing a figure against a gap, and Performance draws those days dotted.