What counts as proof
An in-sample backtest is not proof. What is: out-of-sample and walk-forward results, deflated Sharpe, costs and survivorship taken seriously, a paper record over time, scored calls, and a readiness scorecard.
- Who it is for
- Everyone on the book
- Reading time
- 4 min read
- Updated
Bellwether shows many numbers that look like evidence. Most are weaker than they look, and the console says so next to each one. This is what to trust.
Not proof
An in-sample backtest. A rule tuned on twenty years of history and then scored on the same twenty years has been shown the answers. The Best Sharpe of a sweep is the most flattered number on the by construction; the Lab labels it that way and prints the Luck bar, the Sharpe the luckiest skill-less configuration would have reached.
A raw return on today's mega-caps. The dataset is today's survivors. A backtest over it buys the winners of the last 20 years because they won. Read a strategy by its excess over SPY and the 60/40 mix, never by its raw return, and never treat the raw number as an estimate of live performance.
A backtest without costs, taxes or halts. Every Lab run charges half-spread plus impact on every fill and passes every simulated order through the same the live runs, including the halts. Turnover tells you how much those costs, and taxes, would matter.
A Claude backtest inside its training window. A model asked to "forecast" a date it has already read about may be remembering, not reasoning. Historical walk-forwards here use deterministic only.
Closer to proof
Out-of-sample. The hold-out split (first 70% of sessions against the last 30%) asks whether the second part looks like the first. The walk-forward line of a sweep chooses each year's cell on the prior years only and stitches the out-of-sample years into one curve. That is the only sweep number that deserves a benchmark comparison, and it still only chooses among the cells you submitted.
Deflated Sharpe. The probability that the true Sharpe beats what the best of N skill-less tries would show, after skew, fat tails and sample length. Below about 0.95 the result cannot be told apart from selection luck. A sweep's probability of overfitting answers the same question from the other side: above 0.5 the search is picking noise.
A paper track record over time. Performance is the book's real behaviour: chained daily returns against SPY and 60/40, drawdowns, the trade journal, win rate and expectancy. It cannot be tuned after the fact.
Scored calls. Every 's checkable statements are scored at their horizon from daily closes, with no model grading, and Research shows hits over scored calls on each brief (a combined hit rate across briefs is not computed yet). A Researcher with a hit rate on stated calls has a record; one that only writes prose does not.
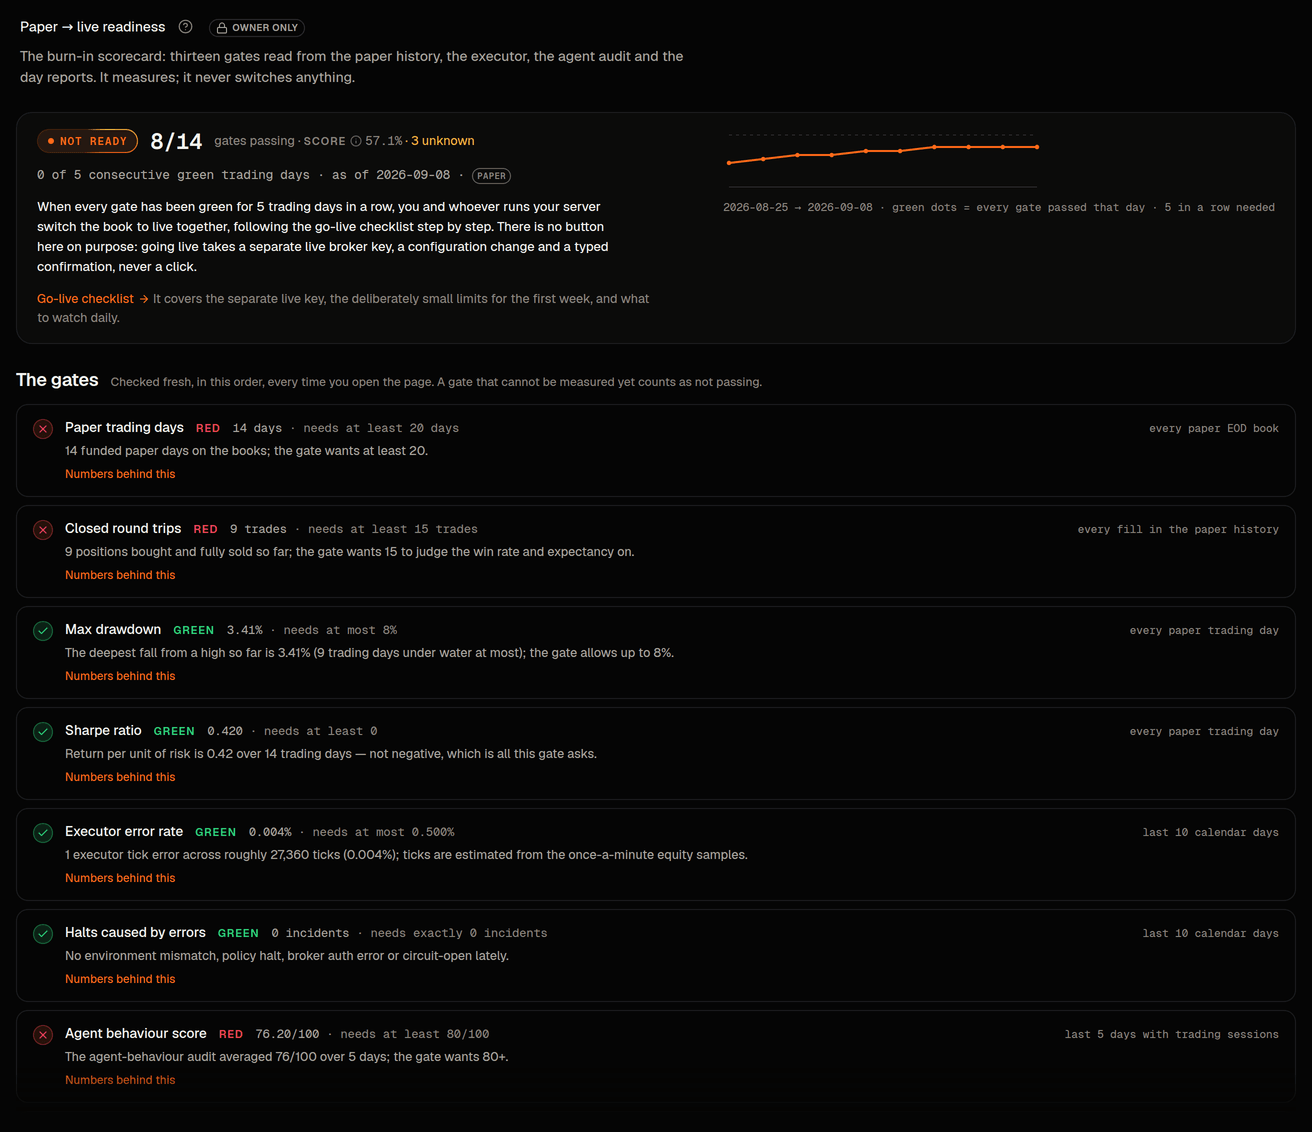
The readiness scorecard. Paper → live readiness (owner only) is a table of gates read from what the system already records. Among them: at least 20 funded paper days, at least 15 closed round trips, a max of 8% or less, a Sharpe of at least 0, no recent incidents, an agent-hygiene audit score of 80 or more, no ignored in the last sessions, AI cost of $2 or less per fill, and green tests. A gate that cannot be measured yet not passing, and thresholds can only be tightened. The verdict reads All gates green only on a day every gate passes, the screen counts consecutive green trading days against the 5 it needs, and even then it only says the paper record is far enough along to start the cut-over runbook; nothing on that screen flips paper to live.
Reading a backtest card honestly
Open an algorithm's Backtest or a run in Lab › Backtests and go in this order:
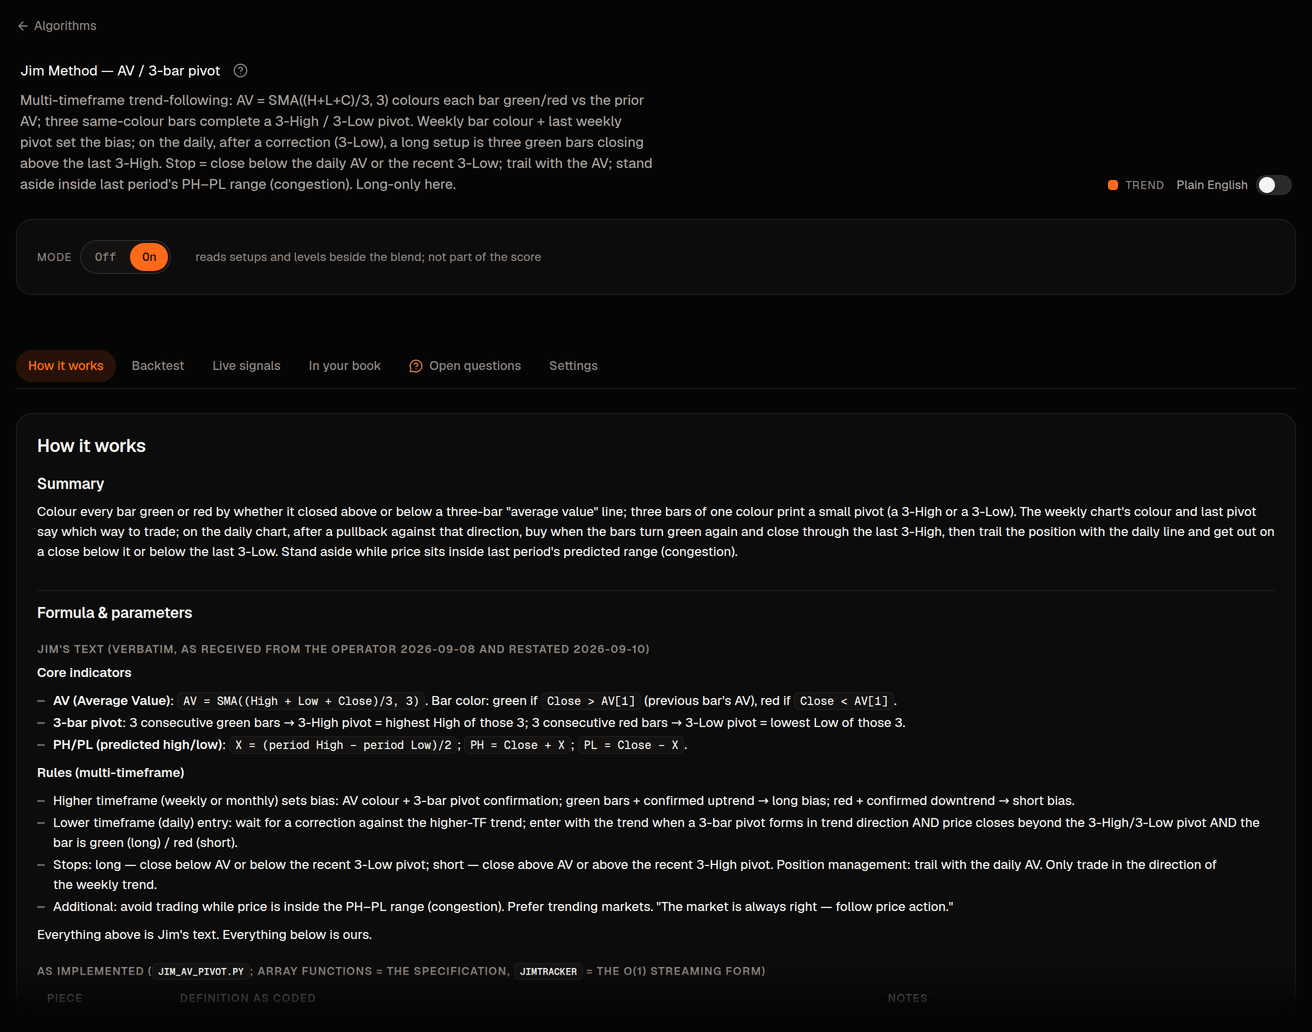
- The window and the universe. Survivors? One regime? The card covers 2006 to 2026 on 20 mega-caps; the by-regime table shows what a long bull market hides.
- The benchmark line. Compare Sharpe and drawdown to SPY over the same years before admiring the CAGR.
- The production profile, not research. Production applies today's caps and halts; research is what the rules do with room to run.
- The Honesty panel on a Lab run, or the Read with care list on an algorithm's card. If deflated Sharpe is low, stop there.
- Trades per year and hit rate. Even good strategies sit near 50–55% on daily hit rate; a card claiming 80% is telling you something is wrong.
A card that survives all five earns a weight in the , and a small one first. More weight is earned in paper.